Hearing Graphs
My latest project is titled Hearing Graphs, and you can access it by clicking on the image below.
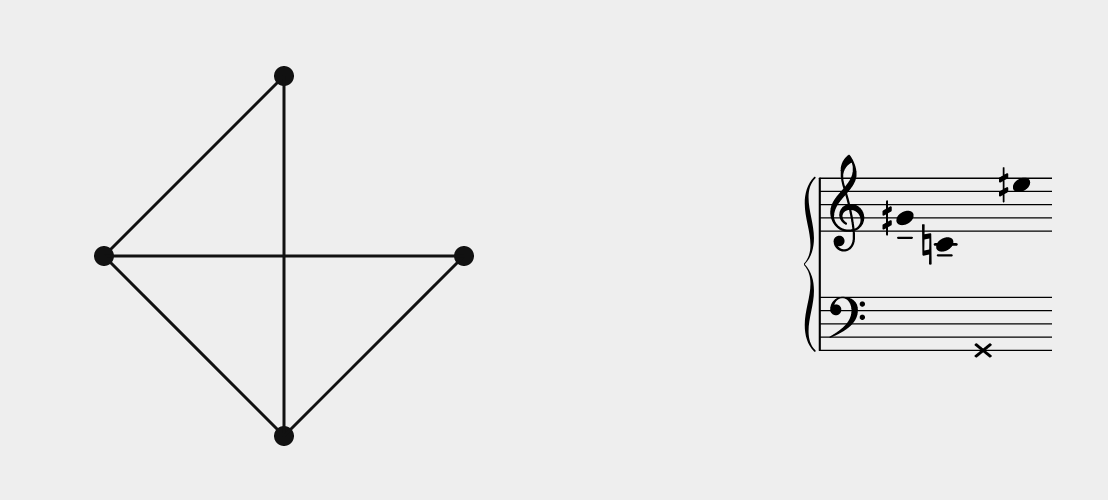
Hearing Graphs is a sonification of graphs using the graph spectrum – the eigenvalues of the graph’s adjacency matrix. Both negative and positive eigenvalues are represented by piano samples, and zero eigenvalues are interpreted with a bass drum. The multiplicity of each eigenvalue is represented by hitting notes multiple times.
Most sonifications establish some audible relationship between the source material and the resulting audio. This one remains mostly incomprehensible, especially to a general audience, so I consider it a failed experiment in that regard. Still, it was fun to make.