OddVoices Dev Log 3: Pitch Contours
This is part of an ongoing series of posts about OddVoices, a singing synthesizer I’ve been building. OddVoices has a Web version, which you can now access at the newly registered domain oddvoices.org.
Unless we’re talking about pitch correction settings, the pitch of a human voice is generally not piecewise constant. A big part of any vocal style is pitch inflections, and I’m happy to say that these have been greatly improved in OddVoices based on studies of real pitch data. But first, we need…
Pitch detection
A robust and high-precision monophonic pitch detector is vital to OddVoices for two reasons: first, the input vocal database needs to be normalized in pitch during the PSOLA analysis process, and second, the experiments we conduct later in this blog post require such a pitch detector.
There’s probably tons of Python code out there for pitch detection, but I felt like writing my own implementation to learn a bit about the process. My requirements are that the pitch detector should work on speech signals, have high accuracy, be as immune to octave errors as possible, and not require an expensive GPU or a massive dataset to train. I don’t need real time capabilities (although reasonable speed is desirable), high background noise tolerance, or polyphonic operation.
I shopped around a few different papers and spent long hours implementing different algorithms. I coded up the following:
Cepstral analysis [Noll1966]
Autocorrelation function (ACF) with prefiltering [Rabiner1977]
Harmonic Product Spectrum (HPS)
A simplified variant of Spectral Peak Analysis (SPA) [Dziubinski2004]
Special Normalized Autocorrelation (SNAC) [McLeod2008]
Fourier Approximation Method (FAM) [Kumaraswamy2015]
There are tons more algorithms out there, but these were the ones that caught my eye for some reason or another. All methods have their own upsides and downsides, and all of them are clever in their own ways. Some algorithms have parameters that can be tweaked, and I did my best to experiment with those parameters to try to maximize results for the test dataset.
I created a test dataset of 10000 random single-frame synthetic waveforms with fundamentals ranging from 60 Hz to 1000 Hz. Each one has harmonics ranging up to the Nyquist frequency, and the amplitudes of the harmonics are randomized and multiplied by \(1 / n\) where \(n\) is the harmonic number. Whether this is really representative of speech is not an easy question, but I figured it would be a good start.
I scored each algorithm by how many times it produced a pitch within a semitone of the actual fundamental frequency. We’ll address accuracy issues in a moment. The scores are:
Algorithm |
Score |
|---|---|
Cepstrum |
9961/10000 |
SNAC |
9941/10000 |
FAM |
9919/10000 |
Simplified SPA |
9789/10000 |
ACF |
9739/10000 |
HPS |
7743/10000 |
All the algorithms performed quite acceptably with the exception of the Harmonic Product Spectrum, which leads me to conclude that HPS is not really appropriate for pitch detection, although it does have other applications such as computing the chroma [Lee2006].
What surprised me most is that one of the simplest algorithms, cepstral analysis, also appears to be the best! Confusingly, a subjective study of seven pitch detection algorithms by McGonegal et al. [McGonegal1977] ranked the cepstrum as the 2nd worst. Go figure.
I hope this comparison was an interesting one in spite of how small and unscientific the study is. Be reminded that it is always possible that I implemented one or more of the algorithms wrong, didn’t tweak it in the right way, or didn’t look much into strategies for improving it.
The final algorithm
I arrived at the following algorithm by crossbreeding my favorite approaches:
Compute the “modified cepstrum” as the absolute value of the IFFT of \(\log(1 + |X|)\), where \(X\) is the FFT of a 2048-sample input frame \(x\) at a sample rate of 48000 Hz. The input frame is not windowed – for whatever reason that worked better!
Find the highest peak in the modified cepstrum whose quefrency is above a threshold derived from the maximum frequency we want to detect.
Find all peaks that exceed 0.5 times the value of the highest peak.
Find the peak closest to the last detected pitch, or if there is no last detected pitch, use the highest peak.
Convert quefrency into frequency to get the initial estimate of pitch.
Recompute the magnitude spectrum of \(x\), this time with a Hann window.
Find the values of the three bins around the FFT peak at the estimated pitch.
Use an artificial neural network (ANN) on the bin values to interpolate the exact frequency.
The idea of the modified cepstrum, i.e. adding 1 before taking the logarithm of the magnitude spectrum, is borrowed from Philip McLeod’s dissertation on SNAC, and prevents taking the logarithm of values too close to zero. The peak picking method is also taken from the same resource.
The use of an artificial neural network to refine the estimate is from the SPA paper [Dziubinski2004]. The ANN in question is a classic feedforward perceptron, and takes as input the magnitudes of three FFT bins around a peak, normalized so the center bin has an amplitude of 1.0. This means that the center bin’s amplitude is not needed and only two input neurons are necessary. Next, there is a hidden layer with four neurons and a tanh activation function, and finally an output layer with a single neuron and a linear activation function. The output format of the ANN ranges from -1 to +1 and indicates the offset of the sinusoidal frequency from the center bin, measured in bins.
The ANN is trained on a set of synthetic data similar to the test data described above. I used the MLPRegressor in scikit-learn, set to the default “adam” optimizer. The ANN works astonishingly well, yielding average errors less than 1 cent against my synthetic test set.
In spite of the efforts to find a nearly error-free pitch detector, the above algorithm still sometimes produces errors. Errors are identified as pitch data points that exceed a manually specified range. Errors are corrected by linearly interpolating the surrounding good data points.
Source code for the pitch detector is in need of some cleanup and is not yet publicly available as of this writing, but should be soon.
Vocal pitch contour phenomena
I’m sure the above was a bit dry for most readers, but now that we’re armed with an accurate pitch detector, we can study the following phenomena:
Drift: low frequency noise from 0 to 6 Hz [Cook1996].
Jitter: high frequency noise from 6 to 12 Hz.
Vibrato: deliberate sinusoidal pitch variation.
Portamento: lagging effect when changing notes.
Overshoot: when moving from one pitch to another, the singer may extend beyond the target pitch and slide back into it [Lai2009].
Preparation: when moving from one pitch to another, the singer may first move away from the target pitch before approaching it.
There is useful literature on most of these six phenomena, but I also wanted to gather my own data and do a little replication work. I had a gracious volunteer sing a number of melodies consisting of one or two notes, with and without vibrato, and I ran them through my pitch detector to determine the pitch contours.
Drift and jitter: In his study, Cook reported drift of roughly -50 dB and jitter at about -60 to -70 dB. Drift has a roughly flat spectrum and jitter has a sloping spectrum of around -8.5 dB per octave. My data is broadly consistent with these figures, as can be seen in the below spectra.
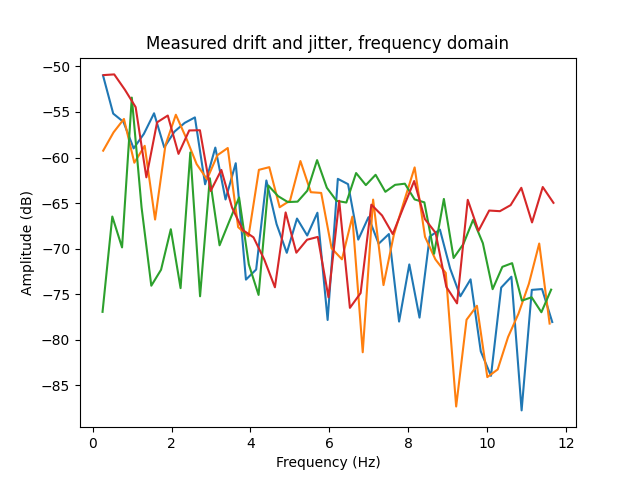
Drift and jitter are modeled as \(f \cdot (1 + x)\) where \(f\) is the static base frequency and \(x\) is the deviation signal. The ratio \(x / f\) is treated as an amplitude and converted to decibels, and this is what is meant by drift and jitter having a decibel value.
Cook also notes that drift and jitter also exhibit a small peak around the natural vibrato frequency, here around 3.5 Hz. Curiously, I don’t see any such peak in my data.
Synthesis can be done with interpolated value noise for drift and “clipped brown noise” for jitter, added together. Interpolated value noise is downsampled white noise with sine wave segment interpolation. Clipped brown noise is defined as a random walk that can’t exceed the range [-1, +1].
Vibrato is, not surprisingly, a sine wave LFO. However, a perfect sine wave sounds pretty unrealistic. Based on visual inspection of vibrato data, I multiplied the sine wave by random amplitude modulation with interpolated value noise. The frequency of the interpolated value noise is the same as the vibrato frequency.
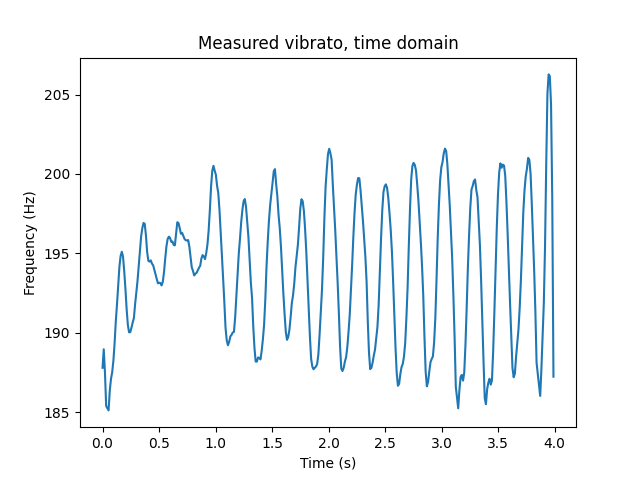
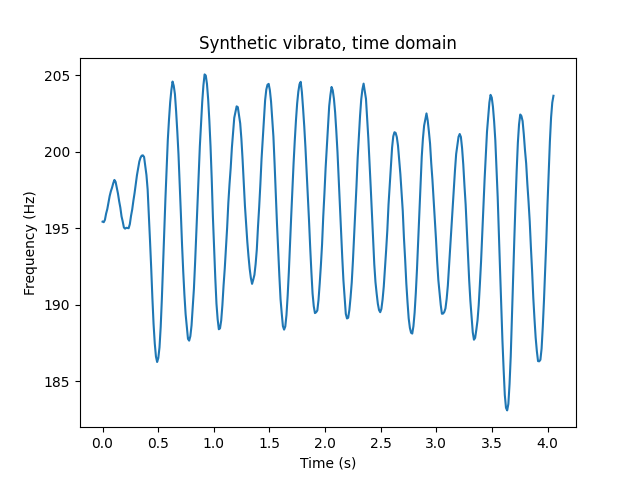
Also note that vibrato takes a moment to kick in, which is simple enough to emulate with a little envelope at the beginning of each note.
Portamento, overshoot, and preparation I couldn’t find much research on, so I sought to collect a good amount of data on them. I asked the singer to perform two-note melodies consisting of ascending and descending m2, m3, P4, P5, and P8, each four times, with instructions to use “natural portamento.” I then ran all the results through the pitch tracker and visually measured rough averages of preparation time, preparation amount, portamento time, overshoot time, and overshoot amount. Here’s the table of my results.
Interval |
Prep. time |
Prep. amount |
Port. time |
Over. time |
Over. amount |
|---|---|---|---|---|---|
m3 ascending |
0.1 |
0.7 |
0.15 |
0.2 |
0.5 |
m3 descending |
no preparation |
0.1 |
0.3 |
1 |
|
P4 ascending |
no preparation |
0.1 |
0.3 |
0.5 |
|
P4 descending |
no preparation |
0.2 |
0.2 |
1 |
|
P5 ascending |
0.1 |
0.5 |
0.2 |
no overshoot |
|
P5 descending |
no preparation |
0.2 |
0.1 |
1 |
|
P8 ascending |
0.1 |
1 |
0.25 |
no overshoot |
|
P8 descending |
no preparation |
0.15 |
0.1 |
1.5 |
|
As one might expect, portamento time gently increases as the interval gets larger. There is no preparation for downward intervals, and spotty overshoot for upward intervals, both of which make some sense physiologically – you’re much more likely to involuntarily relax in pitch rather than tense up. Overshoot and preparation amounts have a slight upward trend with interval size. The overshoot time seems to have a downward trend, but overshoot measurement is pretty unreliable.
Worth noting is the actual shape of overshoot and preparation.
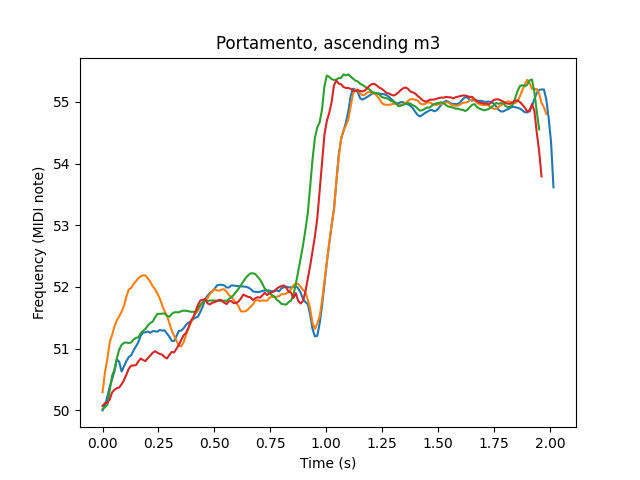
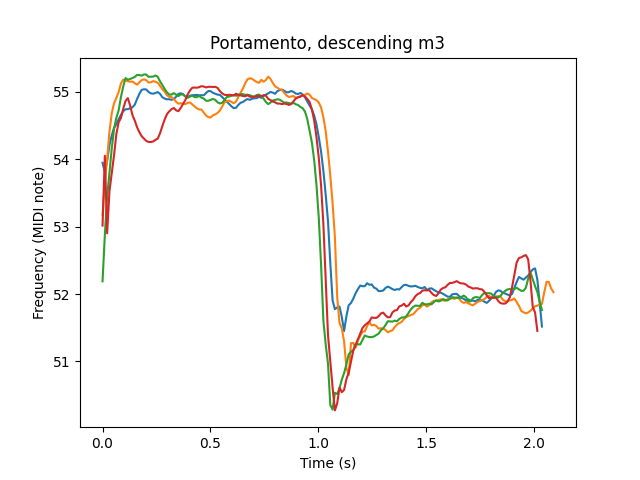
In OddVoices, I model these three pitch phenomena by using quarter-sine-wave segments, and assuming no overshoot when ascending and no preparation when descending.
Further updates
Pitch detection and pitch contours consumed most of my time and energy recently, but there are a few other updates too.
As mentioned earlier, I registered the domain oddvoices.org, which currently hosts a copy of the OddVoices Web interface. The Web interface itself looks a little bland – I’d even say unprofessional – so I have plans to overhaul it especially as new parameters are on the way.
The README has been heavily updated, taking inspiration from the article “Art of README”. I tried to keep it concise and prioritize information that a casual reader would want to know.
References
Noll, A. Michael. 1966. “Cepstrum Pitch Determination.
Rabiner, L. 1977. “On the Use of Autocorrelation Analysis for Pitch Detection.”
Diubinski, M. and Kostek, B. 2004. “High Accuracy and Octave Error Immune Pitch Detection Algorithms.”
McLeod, Philip. 2008. “Fast, Accurate Pitch Detection Tools for Music Analysis.”
Kumaraswamy, B. and Poonacha, P. G. 2015. “Improved Pitch Detection Using Fourier Approximation Method.”
Cook, P. R. 1996. “Identification of Control Parameters in an Articulatory Vocal Tract Model with Applications to the Synthesis of Singing.”
Lai, Wen-Hsing. 2009. “An F0 Contour Fitting Model for Singing Synthesis.”
Lee, Kyogu. 2006. “Automatic Chord Recognition from Audio Using Enhanced Pitch Class Profile.”
McGonegal, Carol A. et al. 1977. “A Subjective Evaluation of Pitch Detection Methods Using LPC Synthesized Speech.”